Access matters, but it is not the whole story.
Regions with fewer birth centers often show higher risk, but the pattern is not perfectly linear, which suggests geography, policy, demographics, and facility quality also matter.

The United States has the highest maternal mortality rate of any wealthy nation — and unlike its peers, that rate is getting worse. This project investigates why, where intervention would matter most, and what policy exports from top-performing countries could look like in practice.
Maternal mortality is one of the only headline health indicators where the U.S. has gone backwards while every comparable country has improved. Our goal is to make the scale of that reversal unignorable — and to trace it to specific, fixable causes.
We're building a data-first investigation that (a) examines regional and racial disparities in maternal death, (b) identifies the leading causes and how they've shifted, (c) benchmarks U.S. performance against top-performing countries to surface transferable policy, and (d) investigates why U.S. rates continue to rise while peer countries' fall.
The data sources we rely on — CDC NCHS, the World Bank, OECD, and peer-reviewed work out of NEJM and NIH — each involve methodology choices. These are the priors we're operating under:
We use the WHO definition of a maternal death: a death during pregnancy or within 42 days of its end from pregnancy-related causes.
We accept the CDC's Maternal Mortality Review Committees' standard that a death is "preventable" if reasonable changes by patient, provider, facility, system, or community could have averted it.
Cross-country comparisons use OECD harmonized rates. U.S. state and county-level numbers may be noisier and we flag small-n rows.
We focus on deaths within the 42-day window. Extending to 1 year (late maternal deaths) roughly doubles the U.S. figure, but that's for a later build.
This page turns the site’s core premise into live, testable evidence: maternal mortality is shaped by care access, geography, and uneven infrastructure. The charts keep the original interactive PHP data calls while giving users clearer instructions, citations, and context.
Regions with fewer birth centers often show higher risk, but the pattern is not perfectly linear, which suggests geography, policy, demographics, and facility quality also matter.
Some states have a larger share of counties without a birth center, but state averages can hide differences between rural and urban counties.
High maternal mortality can appear both in places with limited facilities and in places with multiple facilities, which complicates a simple access-only explanation.
The rubric allows either live PHP/JSON calls or pasted JSON. This build keeps the live PHP feeds and links them here for submission transparency.
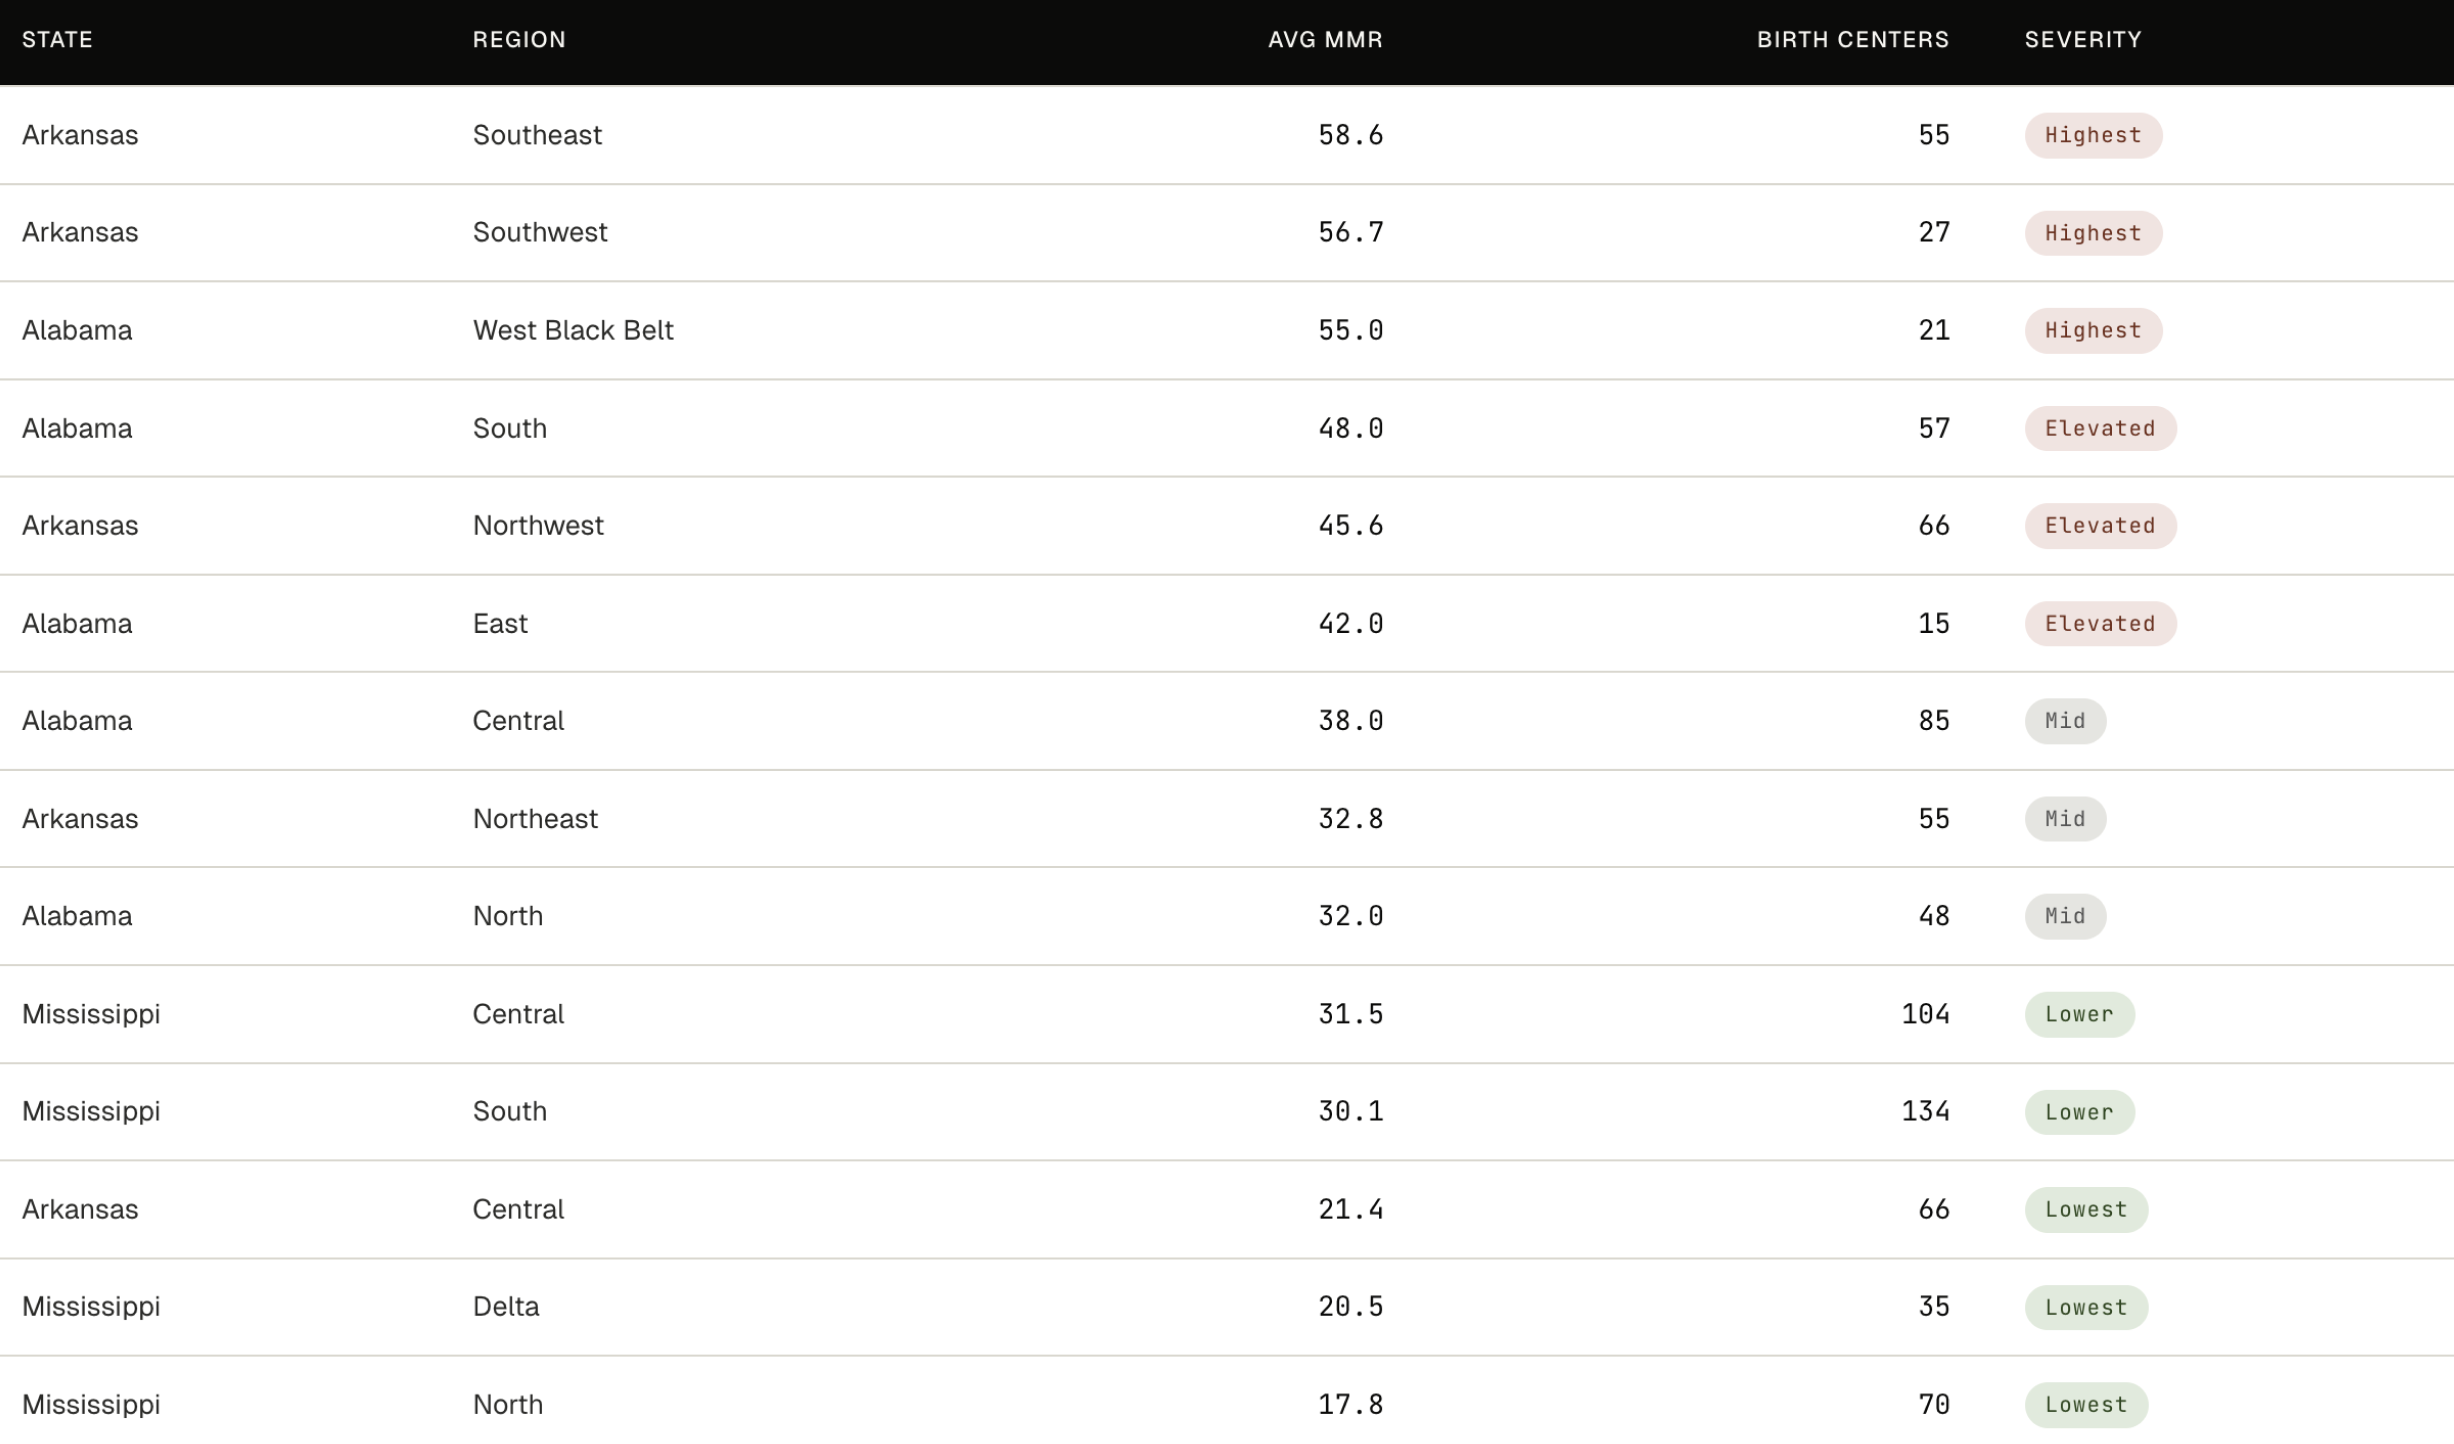
Regions across Arkansas, Mississippi, and Alabama, sorted left to right from least to most OB hospital access (birth centers per 10,000 women aged 15–44, shown beneath each bar). The U.S. national average sits on the far right for context.
Roughly half the regions exceed the national MMR. Access alone does not predict the pattern: some low-access regions have moderate mortality, and some high-access regions are among the deadliest. Geography, demographics, and policy all shape the outcome.
Bars below the threshold are emphasized in red; bars above it keep their state color.
Source: CDC NCHS, HRSA — most recent available year. National MMR figure: 32.9 (CDC, 2021).
This exhibit combines the live regional MMR feed with the live birth-center access-ratio feed. The purpose is to compare mortality against local care access without flattening the results into a single cause.
The share of counties in each state that have no birth center. The median U.S. state appears on the right: half of all states have a higher share, half lower.
Arkansas sits well above the median, with more than a third of its sampled counties lacking a birth center. Mississippi sits above the median. Alabama falls below — a reminder that state averages can mask sharp differences between rural and urban counties.
Switch the dropdown to compare proportions against the underlying county totals.
Source: HRSA, most recent year available. Median U.S. state figure (21%) from Stoneburner et al., "State-Level Prevalence of Maternity Care Deserts," AJPM Focus, 2025. A "birth center" here is any hospital or facility that offers obstetric care. The March of Dimes "maternity care desert" definition is stricter, also requiring no OB-GYNs or midwives in the county.
This exhibit uses the live county birth-center feed. The dropdown is included so users can see both the persuasive percentage view and the underlying raw counts.
Each circle is one county in Arkansas, Mississippi, or Alabama. Color shows the regional maternal mortality rate (deaths per 100,000 live births); size shows the number of birth centers in that county. Hollow rings mark counties with none.
Access alone does not explain the pattern. Some of the highest-mortality regions have many facilities; some of the lowest-mortality regions have few. The crisis is not only about distance to a hospital.
Counties below the threshold stay visible, but fade into the background.
Source: CDC NCHS, HRSA — county-level data, most recent available year.
This map uses the live regional/county MMR feed. Marker color communicates MMR, marker size communicates birth-center count, and hollow rings identify zero-birth-center counties.
Most U.S. Maternal Deaths are
The U.S. has the highest maternal mortality rates among developed regions and its rising
Currently the U.S. maternal mortality rate is
Per 100,000 live births
In regions such as Southeast Arkansas that number becomes
Per 100,000 live births
That's ~2x the national average.
This project helps users understand why this is happening.
Behind every number is a life that could have been saved.
Join ● Preventable now.
The foundational material that informs every chart on this site. Peer-reviewed research, official statistical agencies, and non-partisan policy institutes only.
Clinical-review analysis finding that roughly 84% of U.S. maternal deaths are classified as preventable, even as U.S. MMR rose 136% between 1990 and 2013 while other developed nations' rates fell 38%.
Tracks state-level maternal mortality in the wake of the Dobbs decision: states with abortion bans saw an average 56% increase in maternal mortality; states with protective policies saw a 21% decrease.
Official U.S. vital-statistics data showing Black women die at 4.5× the rate of Asian women — the largest racial mortality gap for this metric of any high-income country.
Cross-country harmonized data 2000–2023. Documents the U.S.-specific finding that homicide, suicide, and drug overdose have replaced hemorrhage as leading causes of U.S. maternal death (2018–2023).
Policy-oriented comparison of maternity care across 11 high-income nations, identifying universal paid leave and midwife-led care as the two strongest correlates of lower MMR.
Long-form investigative reporting pairing statistics with named patient stories. Useful for making aggregate numbers legible and for triangulating what official data often misses.